


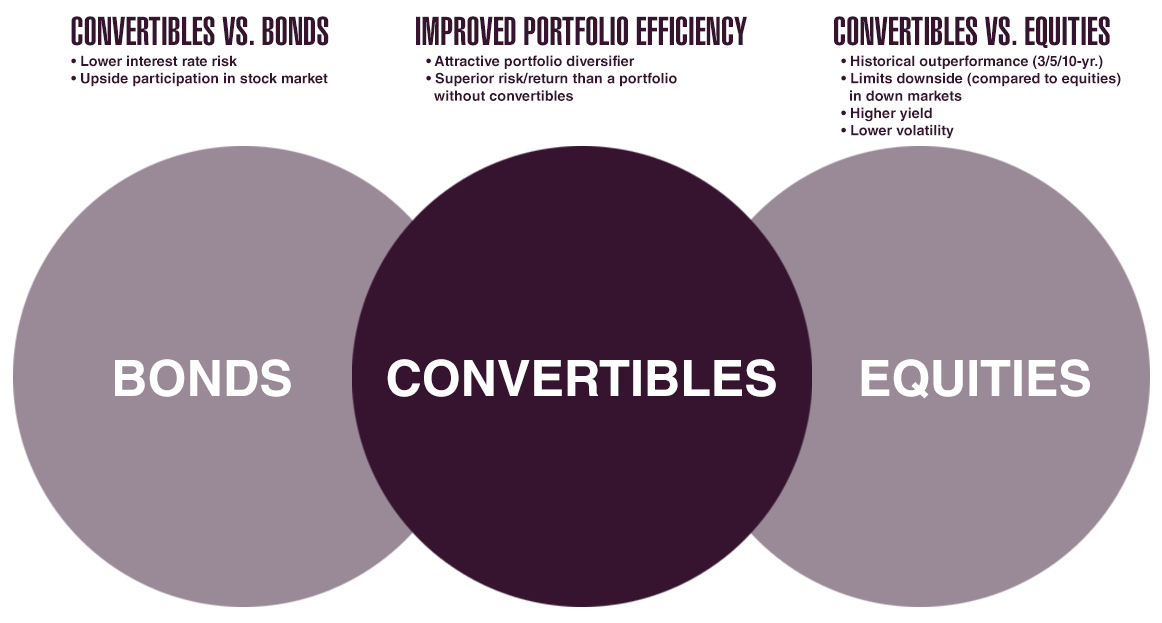
Convertibles
Convertible securities are unique in that they combine features of both equity and debt securities. At the time of issue, a typical convertible security functions like a bond: it pays interest at specified intervals, up until it matures or is repaid. The difference is that instead repaying principal in cash, as a bond would do, it typically offers the investor the option of receiving either cash or a stated number of shares of the issuer’s stock.
The advantage here is evident: in times of rising equity prices, the value of a convertible typically will rise, because the shares in which it would be repaid are worth more. In times of flat or declining equity prices, however, a convertible typically offers good downside protection. The value of the security is protected by the option of receiving the principal back as cash rather than shares.
Convertibles are a long-established and widely recognized type of security. So why don’t investors talk about them very much? The main reason is that the market for these securities is not large enough to be of interest to financial services giants. However, at its current size, the global convertible securities market is more than adequate in terms of liquidity and breadth of choice for investment managers who have the knowledge to specialize in this market.
Comparing the Performance of Convertibles Versus Equity and Bond Indices
Long-term returns of convertibles have offered competitive returns with less volatility than equity markets.
| Returns and Volatility Over 20+ Years (Annualized from 12/30/1994 to 4/30/2026) |
||||
| Asset Class | Index | Annualized Return | Standard Deviation | Sharpe Ratio |
| Convertibles | BAML All US Convertibles Index (VXA0) | 11.5% | 12.7% | 0.51 |
| Large Cap Equity | S&P 500 Total Return Index (SPX) | 13.2% | 15.1% | 0.54 |
| Small Cap Equity | Russell 2000 Total Return Index (RTY) | 11.2% | 20.0% | 0.37 |
| Fixed Income | Bloomberg Barclays US Aggregate Bond Index (LBUSTRUU) | 5.4% | 4.1% | 0.07 |
Source: Bloomberg
| Convertibles Performance vs Equity and Bond Indices (Cumulative total return through 4/30/2026) |
|||||
| Asset Class | Index | One Year | Three Years | Five Years | Ten Years |
| Convertibles | BAML All US Convertibles Index (VXA0) | 36.3% | 65.9% | 39.1% | 233.0% |
| Large Cap Equity | S&P 500 Total Return Index (SPX) | 31.0% | 80.1% | 85.2% | 313.0% |
| Small Cap Equity | Russell 2000 Total Return Index (RTY) | 44.5% | 65.1% | 32.2% | 183.0% |
| Fixed Income | Bloomberg Barclays US Aggregate Bond Index (LBUSTRUU) | 4.1% | 10.8% | 0.9% | 18.0% |
The S&P 500 Total Return Index is a market-cap weighted equity index of 500 large companies in the U.S. and is regarded as a leading proxy for the U.S. stock market.The BofA Merill Lynch All U.S. Convertibles Index (VXA0) tracks the performance of the publicly issued U.S. dollar denominated convertible securities of U.S. companies. The Bloomberg Barclays US Aggregate Bond Index (LBUSTRUU) is a broad-based index that measures the investment grade, U.S. dollar-denominated, fixed-rate taxable bond market and is a commonly used benchmark for the broad investment grade market. Source: Bloomberg